KonMari your data: Planning a query migration using the Marie Kondo method
If you’ve ever heard of Marie Kondo, you’ll know she has an incredibly soothing and meditative method to tidying up physical spaces. Her KonMari Method is about categorizing, discarding unnecessary items, and building a sustainable system for keeping stuff.
As an analytics engineer at your company, doesn’t that last sentence describe your job perfectly?! I like to think of the practice of analytics engineering as applying the KonMari Method to data modeling. Our goal as Analytics Engineers is not only to organize and clean up data, but to design a sustainable and scalable transformation project that is easy to navigate, grow, and consume by downstream customers.
Let’s talk about how to apply the KonMari Method to a new migration project. Perhaps you’ve been tasked with unpacking the kitchen in your new house; AKA, you’re the engineer hired to move your legacy SQL queries into dbt and get everything working smoothly. That might mean you’re grabbing a query that is 1500 lines of SQL and reworking it into modular pieces. When you’re finished, you have a performant, scalable, easy-to-navigate data flow. That does take a bit of planning, but you’ll see that we can take this…

to THIS!
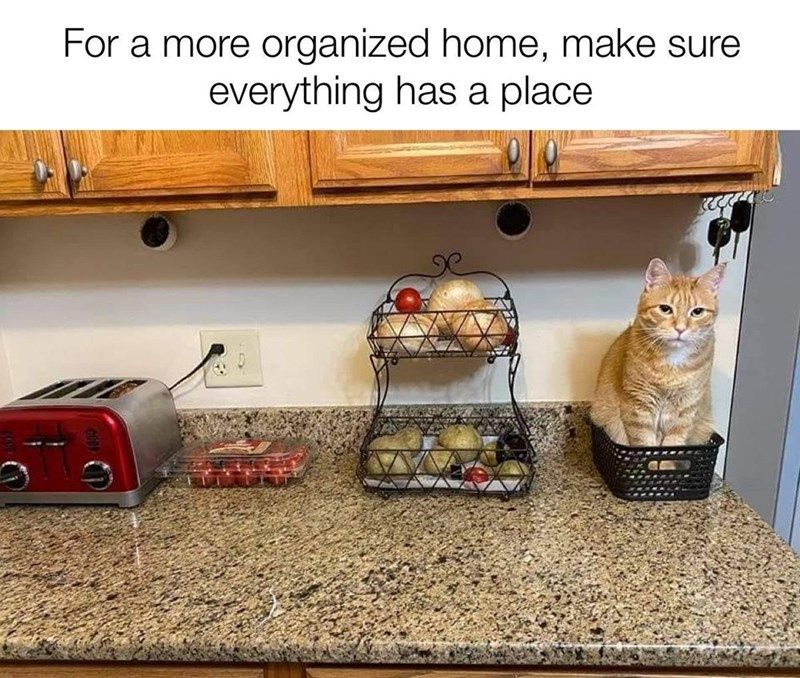
That’s the power of the KonMari Method. Let’s apply the method specifically to data:
KonMari Method
- Commit yourself and stakeholders to tidying up this project
- Imagine the ideal state of this query
- Finish discarding unnecessary models and columns
- Tidy by category
- Follow the right order—downstream to upstream
- Validate that the result sparks joy, AKA, satisfies all of the consumers’ needs
Are you ready to tidy?! Summon Marie Kondo!

Think about when you moved to a new house. Maybe, at some point during the packing process, you got annoyed and just started labeling everything as “kitchen stuff”, rather than what was actually put in the boxes. (Isn’t this…everyone?!) So now, in your new kitchen, you’ve got tons of boxes labeled “kitchen stuff” and you don’t know where everything goes, or how to organize everything. You start to unpack, and your housemates come into the kitchen and ask, why is the Tupperware above the fridge? And why the cooking utensils are in the drawer furthest from the stove?

Before you build, you need to plan. And before you plan, you need to get everyone on the same page to understand how they use the kitchen, so you can organize a kitchen that makes sense to the people who use it. So let’s jump into step one.
Step 1: Commit yourself and stakeholders to tidying up this project
This may feel like an unnecessary step, but haven’t you ever started migrating a new query, only to find out that it was no longer being used? Or people found it so difficult to consume that they instead created their own queries? Or you carved out precious time for this project, but the people you need to be involved have not? Or maybe your consumers expected you to have completed this project yesterday...Initiate anxiety-stomachache now.
Take the opportunity to meet with your stakeholders, and get everyone on the same page. These are likely your report-readers, and your report-builders.
Your readers are the stakeholders who are not the boots-on-the-ground engineers or analysts, but rather the people who rely on the output of the engineering and analysis — Head of Marketing, Head of Sales, etc. — these are your housemates who come into the kitchen searching for a fork to eat the dinner prepared for them.
The builders are the post-dbt data analysts — they transform your thoughtfully-curated tables into beautiful analysis dashboards and reports to answer the readers’ questions — Marketing Analyst, Tableau Guru, Looker Developer — these are your housemates who use your meticulously organized kitchen to cook delicious meals.
You might be thinking, why would I bother the report-reader, when I have the report-builder? Remember, your reader needs to know where the forks live. In this step, it is crucial to set up an initial meeting with all of these people to make sure you’re on the same page about what is being built and why. Then you’ll be able to find one person in the group who can be your phone-a-friend for context questions.
Here are some example questions you’ll want to ask in this initial meeting:
- How is this data table currently being utilized?
- What transformations are being performed on top of this table? Aggregations? Filters? Adjustments? Joins?
- What are the pain points you face with this table? Slow to query? Incorrect outputs? Missing columns? Unnecessary columns?
- What questions do you want this table to answer? Can those questions be broken apart? i.e., Can this table be broken up into smaller tables, each of which answers a different part of the question? Or is it best as one table?
- How can we bucket these sources? Think consumption — where are these subqueries going to be consumed downstream? Do these sources make sense to join upstream?
- If the original table output is incorrect, do they have a table with correct data that we can validate against? How will we know if it is correct?
Step 2: Imagine the ideal state of your project
This is my favorite part. If you dive in to all the boxes labeled “kitchen stuff” with no plan, you’ll end up moving things around multiple times until it feels right. Sometimes, you won’t even get to a place where it feels right before your housemates jumble everything up, because they use the kitchen differently than you. You need the kitchen to flow with the way that you and your housemates use the kitchen — if you know that the silverware goes in the drawer closest to the dishwasher, and the cups and glasses go in the cabinet next to the sink, and the mugs go above the coffee pot, you’ll unpack once and everyone will be able to navigate the kitchen with ease.
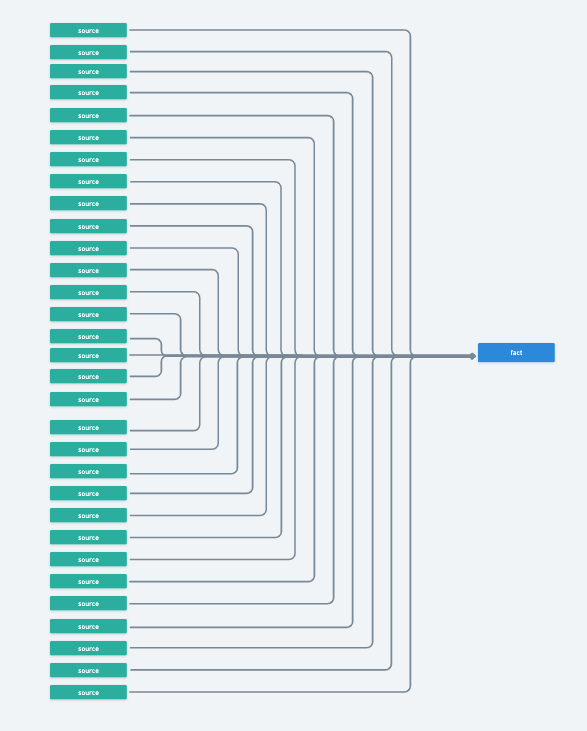
Let’s plan how to unpack our query. This may be what you’re working with: 30+ sources all packed into one SUPER query 🦸.
Or, perhaps you’re migrating a stored procedure, and you have DAG Spaghetti that you’re contending with, as Matt talks through in this article.
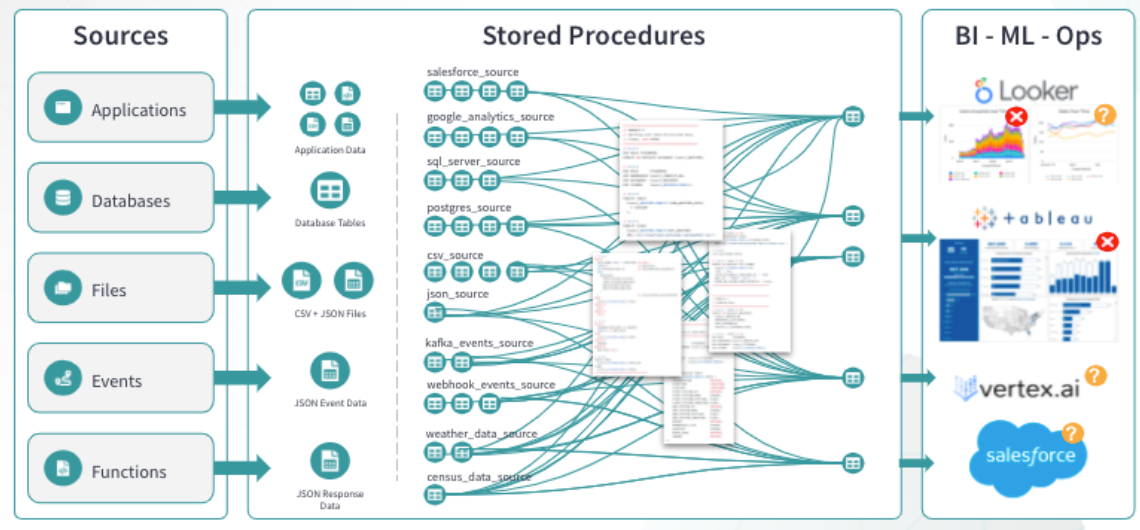
Now we can look at the details of this code, and start to categorize. You can start building out what this may look like as a DAG in a process mapping tool, like Whimsical.
Where can you break a massive query apart, and pull pieces out to create modularizations? Or, where can you combine repeated code to answer a more general question?
- Use your buckets identified in your initial meetings with clients to identify where you can create re-usable intermediate models.
- Locate repeated joins and subqueries to identify more intermediate models.
- Figure out which sources aren’t really providing answers to the questions, and remove them from your design.
Perhaps your redesigned DAG looks something like this — you have intermediate models and joins carved out, creating modular, reusable pieces of code (read more on that here!). You’ve created a data flow devoid of circular logic, and your end-table has all the necessary components to answer your stakeholders’ questions.
*Before you accuse me of wishful thinking, this is the result of a real client project! We broke up almost 1500 lines of code in a single query into this beautiful waterfall. Marie Kondo would be proud.
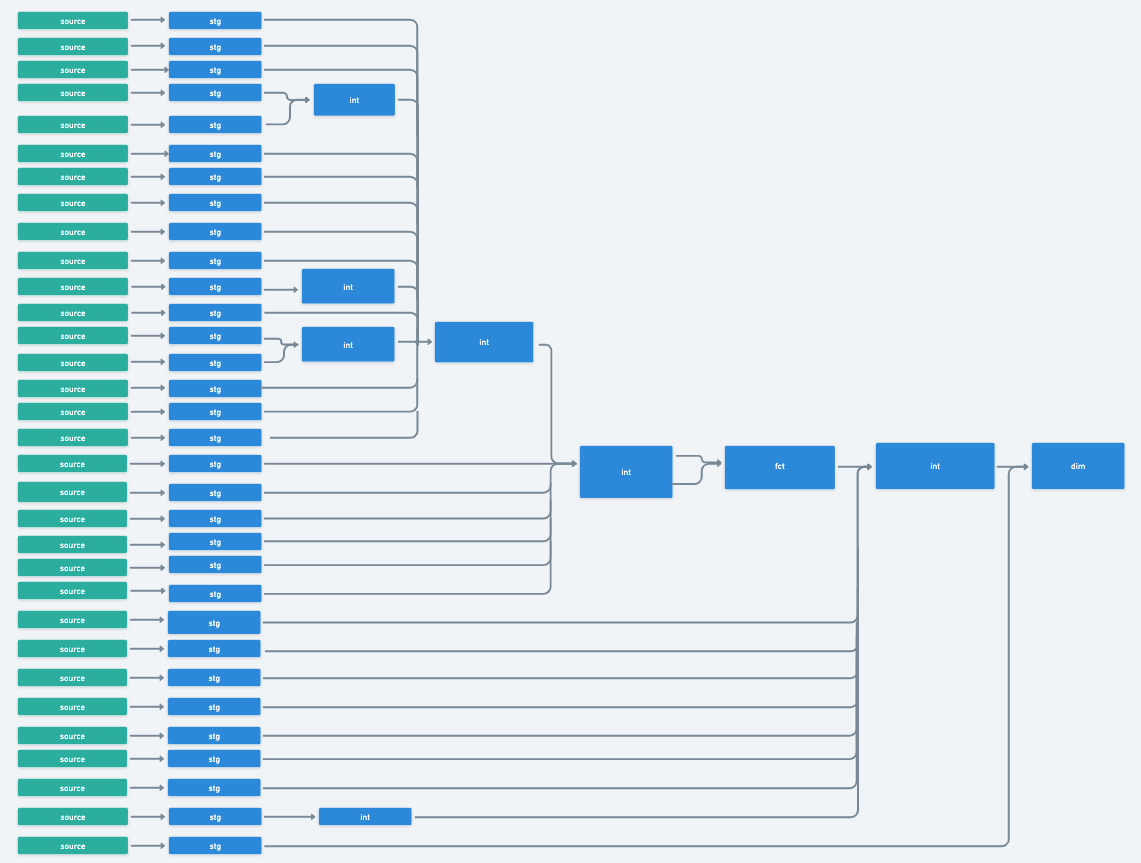
While you don’t have to design your flow this way, it is incredibly important to consider modularity, readability, scalability, and performance in your design. Design with intention! Remember, don’t put your forks too far from the dishwasher.
Step 3: Finish discarding unnecessary models and columns
As you’re pulling items out of your “kitchen stuff” boxes, you may discover that you have Tupperware bottoms without lids, broken dishes, and eight cake pans. Who needs eight cake pans?! No one. There’s some clean out you can do with your kitchen stuff, as well as your data models.
Now that you have your design, and your notes from your stakeholder meeting, you can start going through your query and removing all the unnecessary pieces.
Here are a few things to look for:
- Get rid of unused sources — there’s a package for that!
- Remove columns that are being brought in with import CTEs, but are just clogging your query
- Only bring in the columns you need (this is especially true for BigQuery and Redshift for performance purposes)
- Where you can, do the same with rows! Is a filter being applied in the final query, that could be moved to a CTE, or maybe even an intermediate model?
- Remember that in most cases, it is more performant to filter and truncate the data before the joins take place
Steps 4 & 5: Tidy by category and follow the right order—upstream to downstream
We are ready to unpack our kitchen. Use your design as a guideline for modularization.
- Build your staging tables first, and then your intermediate tables in your pre-planned buckets.
- Important, reusable joins that are performed in the final query should be moved upstream into their own modular models, as well as any joins that are repeated in your query.
- Remember that you don’t want to make these intermediate tables too specific. Don’t apply filters if it causes the model to be consumable by only one query downstream. If you do this, you aren’t creating a scalable project, you’re just recreating the same issue as your original query, but spread amongst mulitple models, which will be hard to untangle later.
Your final query should be concretely defined — is it a fact or dimension table? Is it a report table? What are the stepping stones to get there? What’s the most performant way to materialize?
Build with the goal to scale — when might you need these intermediate models again? Will you need to repeat the same joins? Hopefully you’ve designed with enough intention to know the answer to that last one is “no.” Avoid repeating joins!
Step 6: Validate that the result sparks joy, AKA, satisfies all of the consumers’ needs
When you walk into your newly unpacked kitchen, and the counters are organized, you can unload the dishwasher because the location of the forks is intuitive. You ask your housemate to make dinner for everyone, and they navigate the kitchen with ease!
Ask yourself these questions:
- Does my finished build design spark joy? Meaning, have I executed my build reflective of my scalable design?
- Is it easy to navigate? Is it easy to understand?
- Are all of the pieces easy to consume, when I need to utilize the modularity in the future?
- Does my final query perform well, and answer all of the consumers’ needs?
If your answer is yes to these questions, you’ve sparked JOY. Well done friend! If the answer is no, consider which pieces need to be planned again. If your code isn’t scalable, or easy for consumers to use, start from step one again — gather your consumers, try to understand where communication broke down, and redesign.

Comments